
The tanker market trended higher during the month of August, as demand picked up, OPEC said in its latest monthly report. Dirty tanker spot freight rates continued to pick up in August and now stand at the top of the five-year range. VLCC rates rose a further 16% m-o-m on average, with all reported routes seeing gains. Spot VLCC rates on the Middle East to East route rose 17%. Aframax rates edged up 5% on average, with rates on the Caribbean to US East Coast route up 21%, offsetting declines on Mediterranean routes. Suezmax rates rose 4% on average.
Clean rates fell for the second month in a row, with rates on the NW Europe to US East Coast down 6%.
Spot fixtures
The latest estimates show global spot fixtures declined in August to average 14.6 mb/d. Fixtures fell 1.6 mb/d, or almost 10% m-o-m. Compared with the previous year, spot fixtures were negligibly higher, increasing by less than 1%.

OPEC spot fixtures fell in August, averaging 10.1 mb/d. This represents a decline of 13%, or 1.5 mb/d. In comparison with the same month in 2021, fixtures were about 0.2 mb/d, or over 2%, higher. Middle East-to-East fixtures dropped 1.0 mb/d, or 14%, to average just under 6.0 mb/d. Compared with the same month last year, eastward flows were about 2% higher. Spot fixtures from the Middle East-to-West declined in August by around 0.8 mb/d, or 35%, over the previous month, to average 1.5 mb/d. Y-o-y, rates were 0.6 mb/d, or about 68% higher. By contrast, outside the Middle East, fixtures rose in August to average 2.6 mb/d. This represents a gain of 14%, or about 0.3 mb/d, m-o-m but a decline of 0.5 mb/d, or 15%, y-o-y.

Sailings and arrivals
OPEC sailings increased by 0.1 mb/d, or less than 1%, m-o-m in August to average 22.5 mb/d, and were 1.8 mb/d, or about 9%, higher compared with the same month a year ago. Middle East sailings increased by about 0.3 mb/d in August to average 17.5 mb/d. Y-o-y, sailings from the region rose by 1.9 mb/d, or around 12%, compared with August 2021.
Crude arrivals in August saw m-o-m gains across all regions. The Far East led gains, up by 1.2 mb/d, or almost 9%, to average 14.5 mb/d. Y-o-y, arrivals in the region were 0.3 mb/d, or about 2%, higher. Arrivals in the West Asia were 0.2 mb/d or 2% higher at 8.2 mb/d, while y-o-y, they were 1.0 mb/d, or 14%, higher. In North America, arrivals were 0.3 mb/d or about 4% higher m-o-m, averaging just under 9.0 mb/d, but were marginally lower y-o-y. Arrivals in Europe rose by 0.5 mb/d, or about 4%, to average 13.9 mb/d. This was 1.2 mb/d, or about 10%, higher than in the same month last year.
Dirty tanker freight rates
Very large crude carriers (VLCCs)
VLCC spot rates continued to pick up in August, rising 16% on average m-o-m. The sector saw support from a return of US crude flows to Asia. Y-o-y, VLCC rates were up 111% on average. On the Middle East-to-East route, rates gained 17% m-o-m to average WS68 points and were 119% higher y-o-y. Rates on the Middle East-to-West route rose 17% m-o-m to average WS41 points. Y-o-y, rates on the route increased 95%. West Africa-to-East spot rates gained 17% m-o-m to average WS70 points in August. Compared with the same month last year, rates were 112% higher.

Suezmax
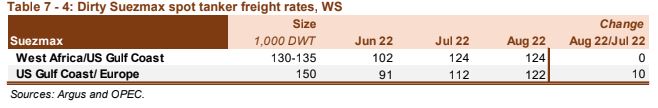
Suezmax rates edged higher in August, increasing 4% m-o-m, to remain well above last year’s lacklustre performance. Rates were supported by ongoing trade dislocations, which boosted demand for longer-haul voyages in the Suezmax class. Rates on the West Africa-to-US Gulf Coast (USGC) route remained at the previous month’s healthy level in August, averaging WS124 points. Compared with the same month last year, rates were 148% higher. Spot freight rates on the USGC-to-Europe route rose 9% over the previous month to average WS122 points. Y-o-y, rates were 221% higher.
Aframax
Aframax spot freight rates also continued to move higher, lifted by the strength of East of Suez and the Atlantic Basin. On average, spot Aframax rates rose 5% m-o-m. Compared with the same month last year, rates were 159% higher. Rates on the Indonesia-to-East route jumped 25% m-o-m to average WS228 points. Y-o-y, rates on the route were up 128%. Spot rates on the Caribbean-to-US East Coast (USEC) route increased 21% m-o-m to average WS299 points. Y-o-y, rates were 260% higher.
By contrast, spot freight rates retraced some of the gains seen in the previous month. Cross-Med spot freight rates fell 4% m-o-m in August, to average WS201 points. Y-o-y, rates were still 134% higher. On the Mediterranean-to-NWE route, rates dropped by a stronger 20% m-o-m to average WS174 points. Compared with the same month last year, rates were around 120% higher.

Clean tanker freight rates
Clean spot freight rates saw across-the-board declines, falling from relatively high levels with the end of the driving season in the Northern Hemisphere and a shift towards refinery maintenance. On average, rates fell 6% m-o-m in August but were still up 129% compared with the levels seen in the same month last year. Losses were seen on both sides of the Suez, but primarily in the East.

Rates on the Middle East-to-East route declined 6% m-o-m in August to average WS269. Y-o-y, rates were up 119%. Freight rates on the Singapore-to-East route dropped by 14% m-o-m to average WS342 but were 116% higher compared with the same month last year. In the West of Suez market, rates on the Northwest Europe (NWE)-to-USEC route decreased 6% m-o-m to average WS291 points. They were 149% higher y-o-y. Rates in the Cross-Med and Med-to-NWE edged down about 1% each to average WS271 and WS282 points, respectively. Compared with the same month last year, rates were 134% higher in the Cross-Med and up 126% on the Med-to-NWE route.
Source: Hellenic Shipping News