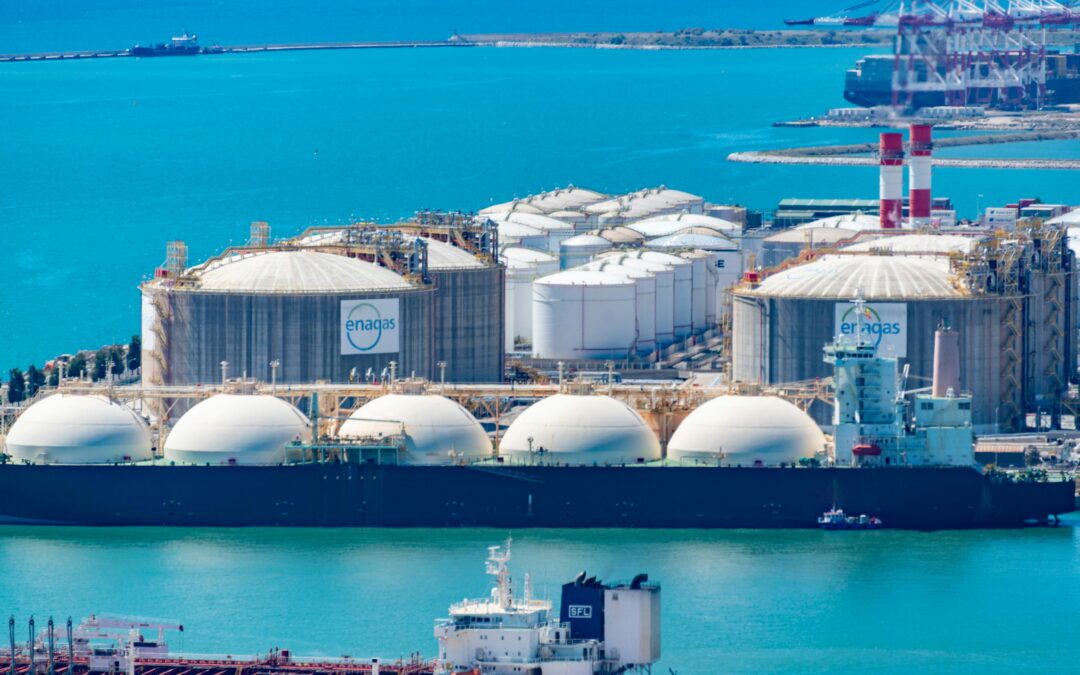
Traditionally, gas supply security has been primarily associated with the availability of natural gas resources and the reliability of supply. However, the recent conflict in the Middle East has brought the security of LNG shipping routes into sharp focus, highlighting the importance of maritime transportation to the resilience of the global gas market. The global LNG trade is inherently shaped by a limited number of strategic maritime chokepoints that are critical to global energy security. As LNG transportation relies on specialised carriers operating between fixed liquefaction and regasification terminals along established shipping routes, disruptions at these waterways can significantly constrain LNG trade. Although alternative routes may exist in some cases, they are typically longer, more costly, and less efficient, making these chokepoints strategic pressure points exposed to geopolitical, security, operational and environmental risks.
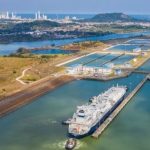
The most critical maritime chokepoints for LNG trade are the Strait of Hormuz, Suez Canal, and Panama Canal, owing to their strategic locations and limited navigational capacity. The number of LNG carrier transits through each of these chokepoints has varied considerably over the recent years (Figure i). The Strait of Hormuz serves as the sole maritime outlet for LNG exports from Qatar and the UAE, accounting for one-fifth of global LNG supply. The Suez Canal, together with the Bab el-Mandeb, forms a critical bidirectional corridor. While it is widely recognised for enabling westbound LNG shipments from the Middle East to Europe, it is equally important for eastbound trade, allowing Atlantic Basin LNG suppliers to serve markets across the Asia-Pacific region. Similarly, the Panama Canal provides the principal maritime shortcut linking LNG exports from the US Gulf Coast and Trinidad and Tobago with Asia-Pacific markets.
In addition, the Strait of Malacca and the Cape of Good Hope, while important for global LNG shipping, are generally considered less critical to the resilience of global LNG trade. The Strait of Malacca, through which 17% of global LNG carrier sailings pass, is complemented by alternative routes through the Indonesian archipelago, in contrast to the Strait of Hormuz. The Cape of Good Hope, by comparison, is an open-ocean route rather than a narrow maritime chokepoint and therefore does not rely on a single constrained navigational corridor susceptible to blockage. Consequently, disruptions along these routes are less likely to severely impede global LNG trade or undermine the resilience of global LNG supply chains.
Each of these five maritime routes is exposed to a distinct combination of geopolitical, security, operational and environmental risks that can disrupt global LNG trade. The Strait of Hormuz is mainly exposed to geopolitical tensions and military conflict, reflecting its role as the sole maritime outlet for LNG exports from the Gulf. The Suez Canal faces predominantly regional security risks, particularly instability in the Red Sea region that can disrupt vessel transits. By contrast, the Panama Canal is chiefly affected by environmental risks, especially drought-induced water shortages that reduce canal capacity. The Strait of Malacca is primarily exposed to navigational congestion, maritime accidents, and localized security incidents. Likewise, the Cape of Good Hope is mainly exposed to adverse weather conditions and the operational challenges associated with significantly longer voyage distances. In addition to these route-specific risks, piracy remains an intermittent security threat along certain LNG shipping routes.
These risks have moved beyond theoretical concerns and have had tangible consequences for global LNG shipping. In particular, the unprecedented simultaneous disruption of the Suez Canal and Panama Canal routes in 2024, driven by security concerns and environmental constraints, respectively, has fundamentally reshaped global LNG shipping patterns. Prior to these disruptions, LNG carrier transits through both canals had increased steadily, reaching record levels in 2021, as they served as critical maritime shortcuts linking LNG supplies from the US and the Middle East with markets in Europe and Asia. However, the convergence of geopolitical instability in the Middle East and severe drought affecting Gatun Lake triggered a sharp decline in traffic through both corridors. LNG carrier transits through the Suez Canal fell from a peak of 509 in 2021 to 140 in 2025, while transits through the Panama Canal declined from 251 to 32 over the same period. During these years, global LNG exports increased by approximately 500 cargoes to more than 6,500 cargoes annually, underscoring an even more pronounced decline in the relative importance of both canals within the global LNG transportation network.
Consequently, LNG carriers have increasingly been rerouted via the Cape of Good Hope, transforming it from an occasional diversionary route into a major shipping corridor despite significantly longer voyage distances, reduced shipping efficiency, and higher transportation costs. The shift in global LNG shipping patterns has fundamentally altered the commercial economics of LNG transportation by widening the time and cost differentials between direct canal transits and longer diversionary routes. For example, a voyage from the US Gulf Coast to Japan takes 20 days via the Panama Canal but 34 days when rerouted via the Cape of Good Hope. Similarly, a shipment from the US Gulf Coast to India takes 23 days via the Suez Canal, compared with 30 days via the Cape of Good Hope. Middle Eastern LNG exports to Southwest Europe exhibit a similar pattern, with shipments from Qatar requiring 17 days via the Suez Canal and 27 days when rerouted via the Cape of Good Hope.
An even greater shock to the global LNG market occurred following the blockade of the Strait of Hormuz amid the escalation of the Middle East conflict beginning on 28 February 2026. As the Strait of Hormuz is the sole maritime export route for LNG shipments from Qatar and the UAE, any disruption to vessel movements through the Strait poses an immediate risk to global gas supply security.
The blockade has effectively brought LNG exports from both countries to a standstill, triggering an unprecedented disruption to global LNG trade. Between March and June 2026, the global LNG market lost more than 300 Qatari LNG cargoes and around 20 from the UAE. The sudden removal of one-fifth of global LNG supply from international markets exacerbated market tightness, forcing importing countries to secure alternative LNG supplies and diversify their energy mix, thereby significantly reshaping global LNG trade flows.
An estimated 160 LNG carriers were stranded inside the Gulf or forced to remain at anchor in the Gulf of Oman following the blockade, creating an acute shortage of available vessels. As a result, the LNG shipping market experienced an unprecedented shock, with spot charter rates rising to levels not seen since the peak of the 2022 energy crisis. Daily spot charter rates for Tri-Fuel Diesel Electric (TFDE) carriers surged to $235,000/day in early March, compared with just $5,000/day in early February. At the monthly level, average TFDE spot rates increased from $18,000/day in February to $108,000/day in March (Figure ii). The market tightening extended across the entire LNG fleet. Even legacy steam turbine carriers, the least fuel-efficient vessels and a segment undergoing gradual phase-out, experienced a sharp recovery in demand, with average monthly spot charter rates rising from $3,000/day to $50,000/day.
Another key driver of elevated freight rates was the contraction in effective fleet capacity resulting from the sharp expansion in ton-mile demand. With the Red Sea designated a high-risk area and the Suez Canal route effectively bypassed, LNG carriers were increasingly rerouted around the Cape of Good Hope. This diversion extended a typical ballast or laden voyage between the Atlantic Basin and Asia-Pacific markets by 15–20 days, substantially increasing the time each vessel remained employed per voyage. As a result, a larger fleet was required to transport the same volume of LNG, reducing the availability of vessels in the spot market and placing sustained upward pressure on charter rates. These capacity constraints began to ease in April 2026, as a significant number of vessels previously committed to long-term Qatari contracts became available for spot employment following the sharp decline in Qatari LNG exports.
Marine bunker fuel prices, another key component of LNG shipping costs, are closely linked to global crude oil benchmarks. Consequently, the surge in crude oil prices following the blockade of the Strait of Hormuz translated into a sharp increase in marine fuel costs. In March 2026, the average bunker fuel price for the LNG carrier fleet rose by 73% m-o-m to more than $800/t, reaching its highest level since the peak of the 2022 energy crisis (Figure iii). Although bunker fuel prices subsequently eased from these highs, they became increasingly decoupled from crude oil benchmarks. This divergence reflected persistent supply-demand imbalances at major bunkering hubs, compounded by refining bottlenecks. The widespread rerouting of LNG carriers via the Cape of Good Hope increased fuel consumption and concentrated bunkering demand at a limited number of strategic ports. As demand outpaced local fuel inventories and refinery output, bunker fuel premiums remained elevated despite fluctuations in crude oil prices.
Insurance costs also increased sharply, adding another major source of cost escalation for LNG shipping. The maritime insurance sector experienced severe disruption as leading global underwriters issued blanket cancellations of war-risk cover for the Gulf and adjacent waters. For the few LNG carriers still attempting to navigate the region at the onset of the conflict, Additional War Risk Premiums escalated dramatically. Standard transit premiums, which averaged around 0.25% of a vessel’s hull and machinery value before the conflict, surged to between 5% and 10% for voyages through the Strait of Hormuz. For an LNG carrier valued at
$250 million, this translated into a single-transit insurance cost of up to $25 million, representing a forty-fold increase that often exceeded the commercial margin of the cargo. The tightening of insurance markets also extended to cargo cover, with premiums for LNG cargoes rising to between 10% and 20% of cargo value during the peak of hostilities.
The combined impact of longer voyage distances, soaring charter rates, higher shipping fuel prices, and escalating insurance premiums resulted in a surge in overall LNG shipping costs. For example, the cost of transporting LNG on a TFDE carrier from the US Gulf Coast to Southwest Europe averaged $1.1/MMBtu in Q2 2026, compared with $0.6/MMBtu a year earlier. The increase was even more pronounced on voyages to Northeast Asia, where shipments routed via the Cape of Good Hope averaged $3.6/MMBtu in Q2 2026, compared with $1.8/MMBtu in Q2 2025. By comparison, shipments transiting the Panama Canal averaged $2.8/MMBtu in Q2 2026, highlighting the substantial cost premium associated with the longer Cape route.
Consequently, the share of spot shipping costs in the total delivered price of spot LNG cargoes increased sharply. In July 2025, spot shipping costs from the US Gulf Coast to Europe averaged $0.7/MMBtu, while European spot gas prices were $12/MMBtu, meaning freight accounted for 6% of the delivered price. By March 2026, however, spot shipping costs had risen to $2/MMBtu, increasing freight’s share to more than 10% of the delivered value. A similar trend was observed on the US Gulf Coast–Northeast Asia route via the Panama Canal, where spot shipping costs increased from $1.6/MMBtu, representing 13% of the delivered price in July 2025, to nearly $5/MMBtu by March 2026, accounting for one-quarter of the total delivered LNG price.
Looking ahead, the commissioning of around 250 Mtpa of new global liquefaction capacity by 2030 is expected to reshape LNG shipping patterns and alter the relative importance of key maritime routes and traditional chokepoints. Nearly half of this new capacity is concentrated along the US Gulf Coast, increasing pressure on the Panama Canal as growing volumes of US LNG exports compete for transit to Asian markets. Although long-term slot reservation systems will continue to facilitate canal access, the projected scale of future LNG trade is expected to increase the use of longer alternative routes, particularly via the Cape of Good Hope elevating their role from occasional diversionary routes to an integral component of global LNG shipping.
At the same time, the emergence of new LNG export hubs beyond the US Gulf Coast is expected to diversify global trade flows and reduce dependence on traditional maritime chokepoints. Export terminals under development on the Canadian and Mexican Pacific coasts will enable North American LNG to reach Asian markets directly across the Pacific Ocean, bypassing the Panama Canal altogether. Likewise, under-development and planned LNG projects in Africa will be strategically positioned to supply both European and Asian markets through diversified shipping routes. Although global LNG trade is projected to expand substantially, these evolving supply patterns are expected to reduce the concentration of LNG flows through a limited number of strategic chokepoints, thereby enhancing the flexibility and resilience of the global LNG transportation network and strengthening global energy security.
Source: GECF