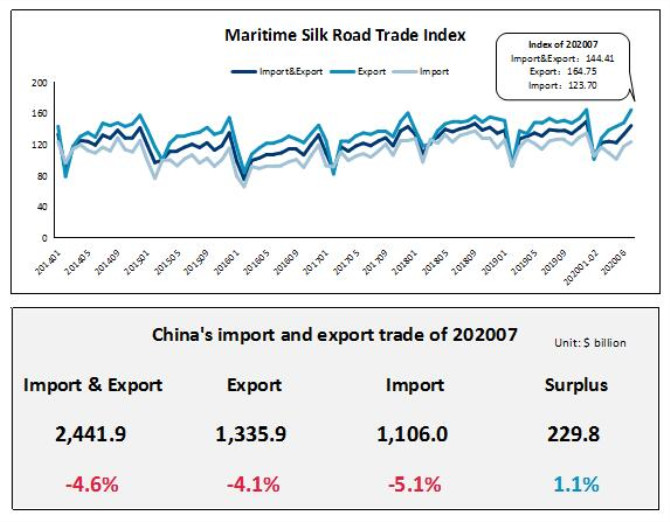
In July 2020, the Maritime Silk Road Trade Index (STI) released by the Ningbo Shipping Exchange showed that the import and export trade index was 144.41points, up 8.46% from the previous month and up 3.75% year-on-year; the export trade index was 164.75 points, up11.26% from the previous month , a year-on-year increase of 7.27%; the import trade index was 123.70 points, a increase of 4.88% month-on-month and a year-on-year down of 0.67%.
From January to July, China’s total import and export trade value was US$244.926 billion, a year-on-year decrease of 4.57%. Total export trade value was US$1.335879 billion, down 4.11% year-on-year; the total import trade value was US$1106.047 billion, down 5.12% year-on-year.
China’s trade with continents
From January to July, the import and export trade volume between China and Asia was US$1,265.191 billion, down 3.49% year-on-year, accounting for 51.81% of my country’s total import and export volume. The export trade volume was 644.827 billion U.S. dollars, down 4.61% year-on-year; the import trade volume was 620.364 billion U.S. dollars, down 2.29% year-on-year.
From January to July, the import and export trade volume between China and Europe was US$478.372 billion, down 3.21% year-on-year, accounting for 19.59% of my country’s total import and export volume. The export trade volume was US$280.912 billion, up 0.42% year-on-year; the import trade volume was US$197.46 billion, down 7.95% year-on-year.
From January to July, the import and export trade volume between China and Africa was US$99.025 billion, down 17.89% year-on-year, accounting for 4.06% of my country’s total import and export volume. The export trade volume was 58.671 billion U.S. dollars, down 7.32% year-on-year; the import trade volume was 40.354 billion U.S. dollars, down 29.56% year-on-year.
From January to July, the import and export trade volume between China and North America was US$321.871 billion, a year-on-year decrease of 7.11%, accounting for 13.18% of my country’s total import and export volume. The export trade volume was USD 241.817 billion, down 6.70% year-on-year.
From January to July, the import and export trade volume between China and Latin America was US$167.095 billion, a year-on-year decrease of 5.05%, accounting for 6.84% of my country’s total import and export volume. Export trade volume was 76.059 billion US dollars, down 8.79% year-on-year; import trade volume was 91.035 billion US dollars, down 1.68% year-on-year.
From January to July, the import and export trade volume between China and Oceania was US$110.056 billion, up 0.04% year-on-year, accounting for 4.51% of my country’s total import and export volume. The export trade volume was 33.592 billion U.S. dollars, up 6.43% year-on-year; the import trade volume was 76.464 billion U.S. dollars, down 2.54% year-on-year.
Source:- Hellenic Shipping News